Improved Phosphorus prescription maps – beyond replacement P (TC219)
START
April 1, 2019
FINISH
June 30, 2021

Tags: ag tech | fertiliser | Mid North | NDVI | P P response | phosphorus | satellite imagery | soil EC | soil mapping | soil pH | spatial data | Yorke Peninsula
Summary
Phosphorus rates required to optimise partial gross margins vary widely across paddocks according to soil type and production zones.
In trials across five paddocks in the Mid North and northern Yorke Peninsula regions, optimal rates were shown to vary from 0 kilograms per hectare to 40kg/ha.
Combining spatial data layers such as soil pH and historical satellite imagery in advance of seeding provided a good prediction of P response. A methodology for using data layers to create variable rate P prescriptions has been developed.
Background
Phosphorus fertiliser inputs are one of the largest variable input costs for grain farmers in SA. Spatial map layers such as grain yield, soil pH, soil EC and NDVI can infer useful information about potential P uptake, soil tie-up and P response.
It should be possible to use these data layers to develop variable prescription maps for P application to increase P fertiliser use efficiency and minimise over-application. However, the best methodology for integrating these data layers to produce variable rate P prescription maps has not been established.
Research Aims
The core objectives of the project were to:
- Increase the profitability derived from P fertiliser application.
- Better understand how spatial data layers can be integrated to produce variable rate prescription maps that optimise P rates across variable paddocks.
In The Field
Data layers for yield, soil pH, soil EC and NDVI were collated for five paddocks near Bute, Koolunga, Brinkworth, and Kybunga. Using computer software to combine data layers, areas of high and low yield, pH and NDVI were identified.
This provided 21 targeted response trial sites across these paddocks over the two seasons. Treatments of P at rates of 0, 5, 10, 20, 30 and 50 kilograms per hectare were applied as MAP for comparison with the P responses predicted by the data maps. Nitrogen rates were matched between the treatments using adjusted rates of urea.
Sixteen additional sites at the same locations were treated with chicken litter (5t/ha) or biosolids (5.0t/ha) to determine the P response from these products.
The relationship between the observed P response at the 21 trial sites and the predicted response was then used to develop an algorithm using the data layers to calculate optimal P rates and P prescription maps.
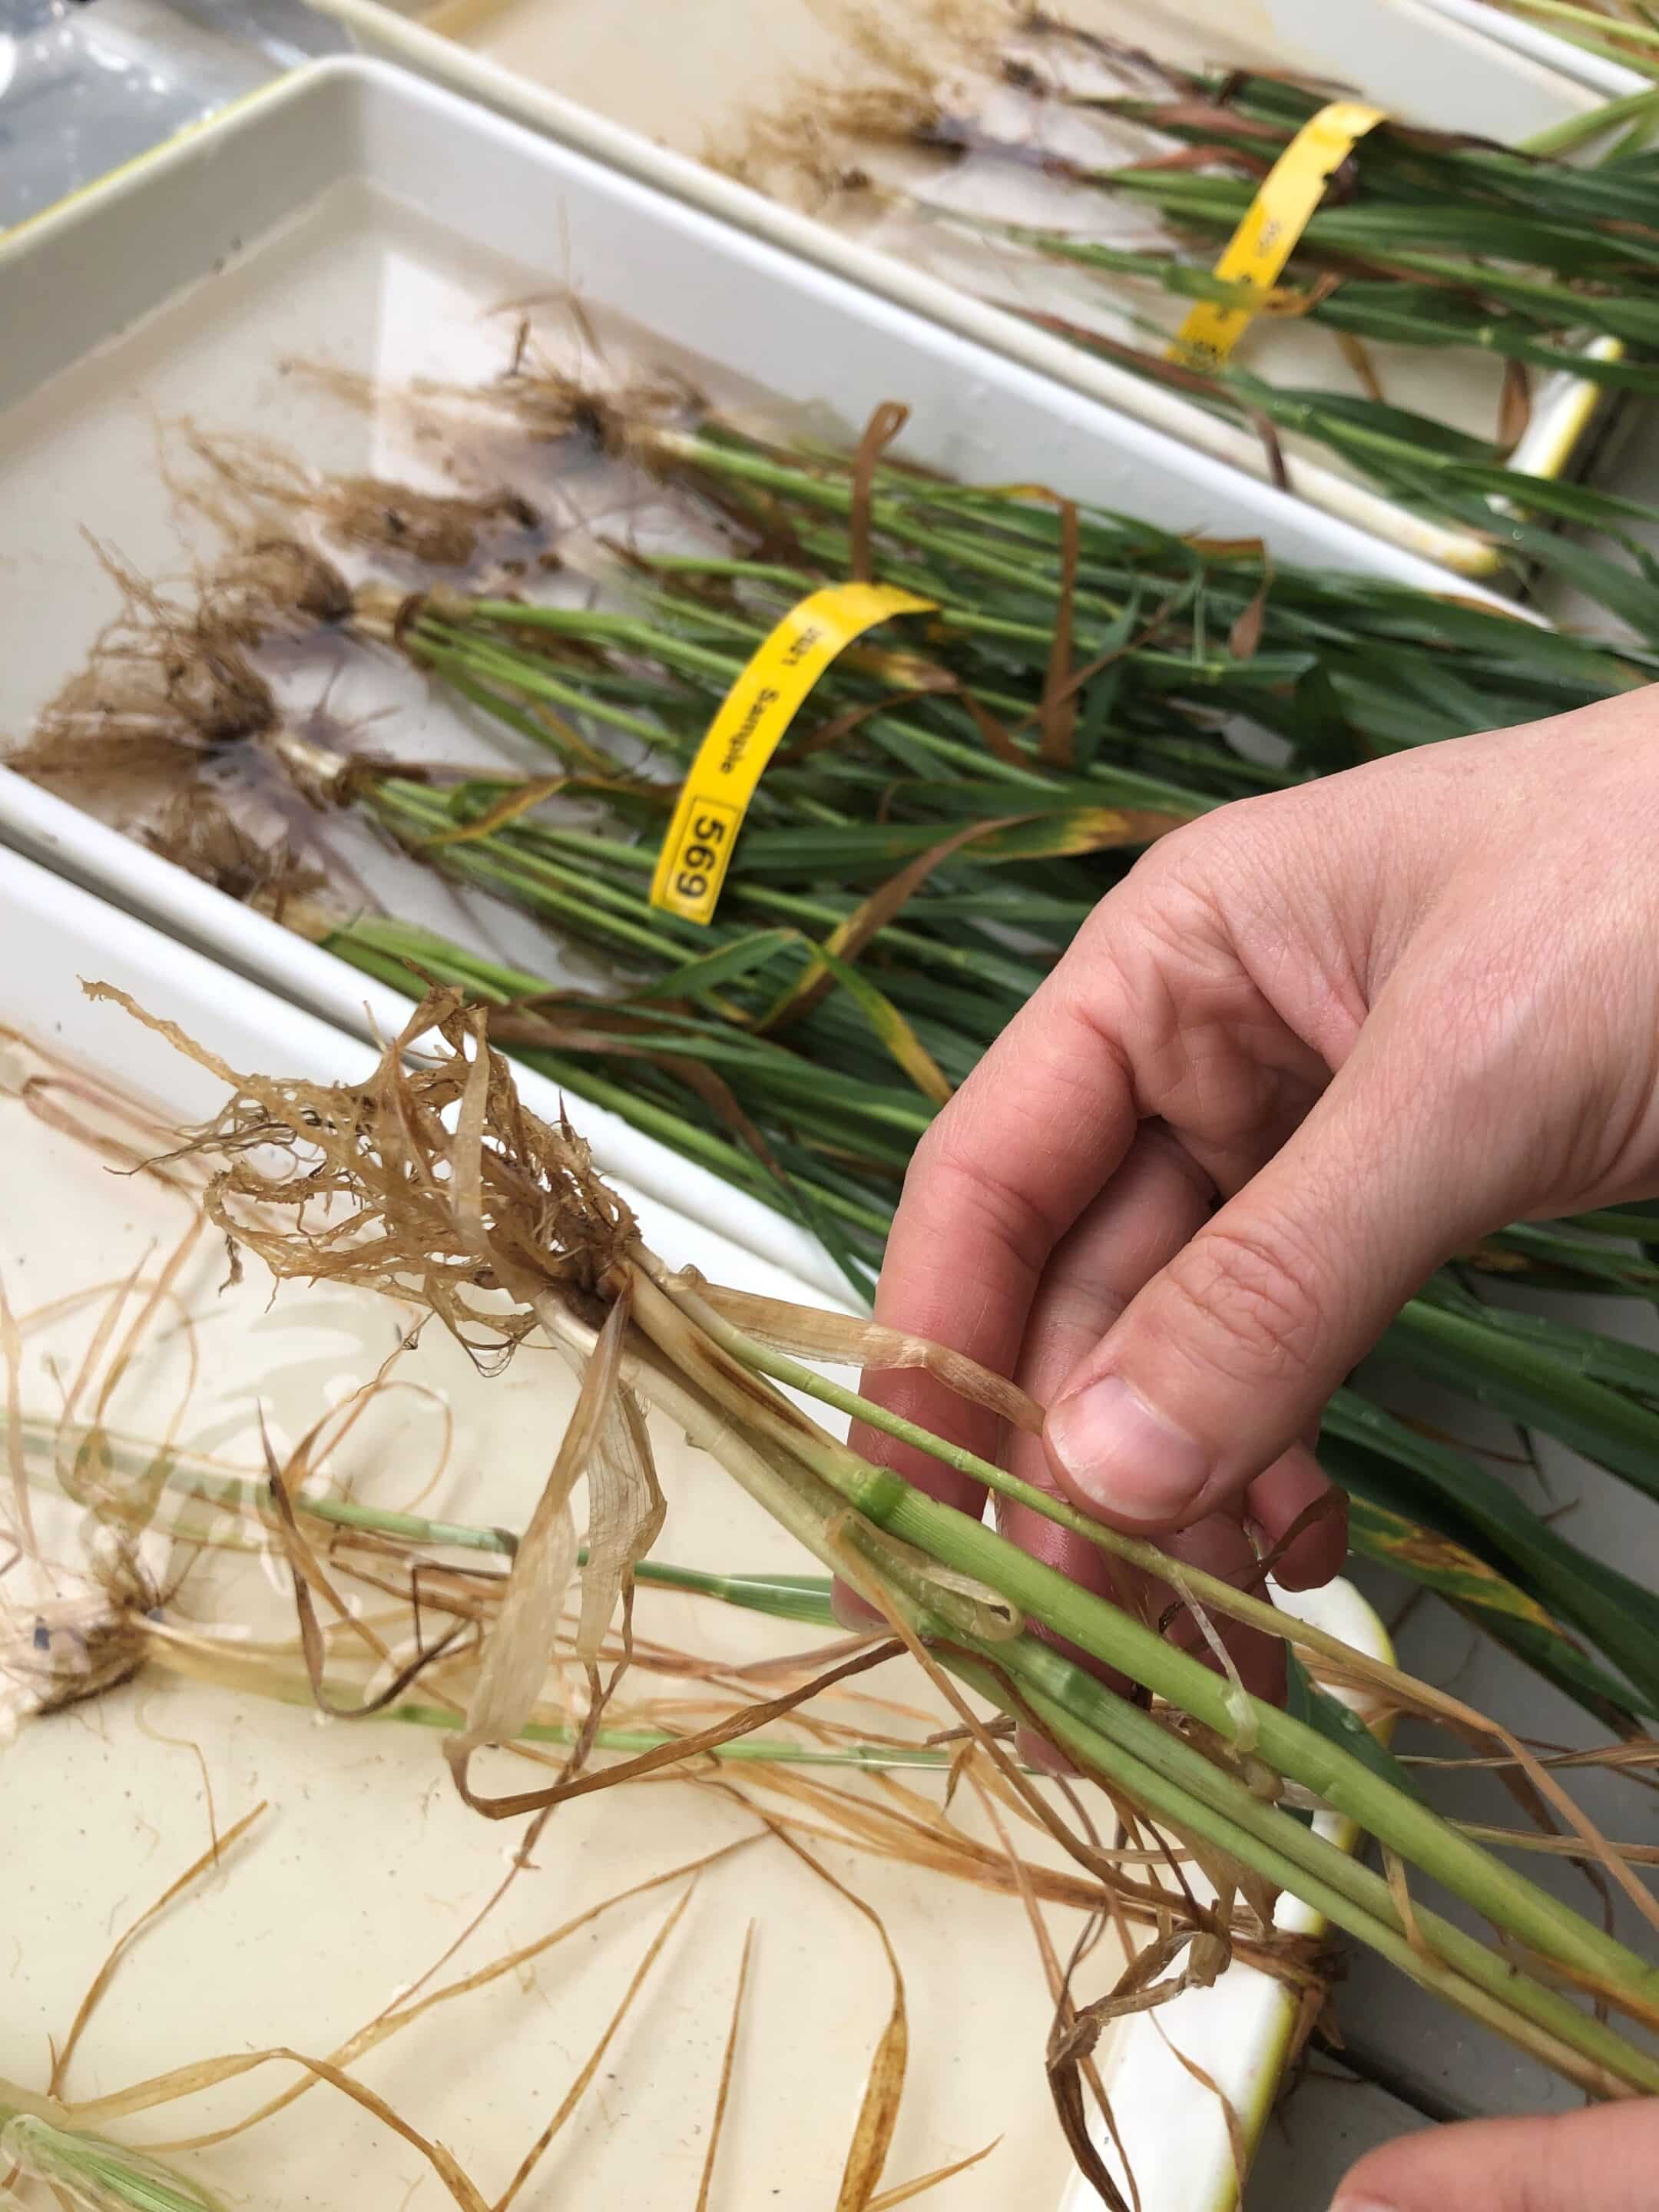
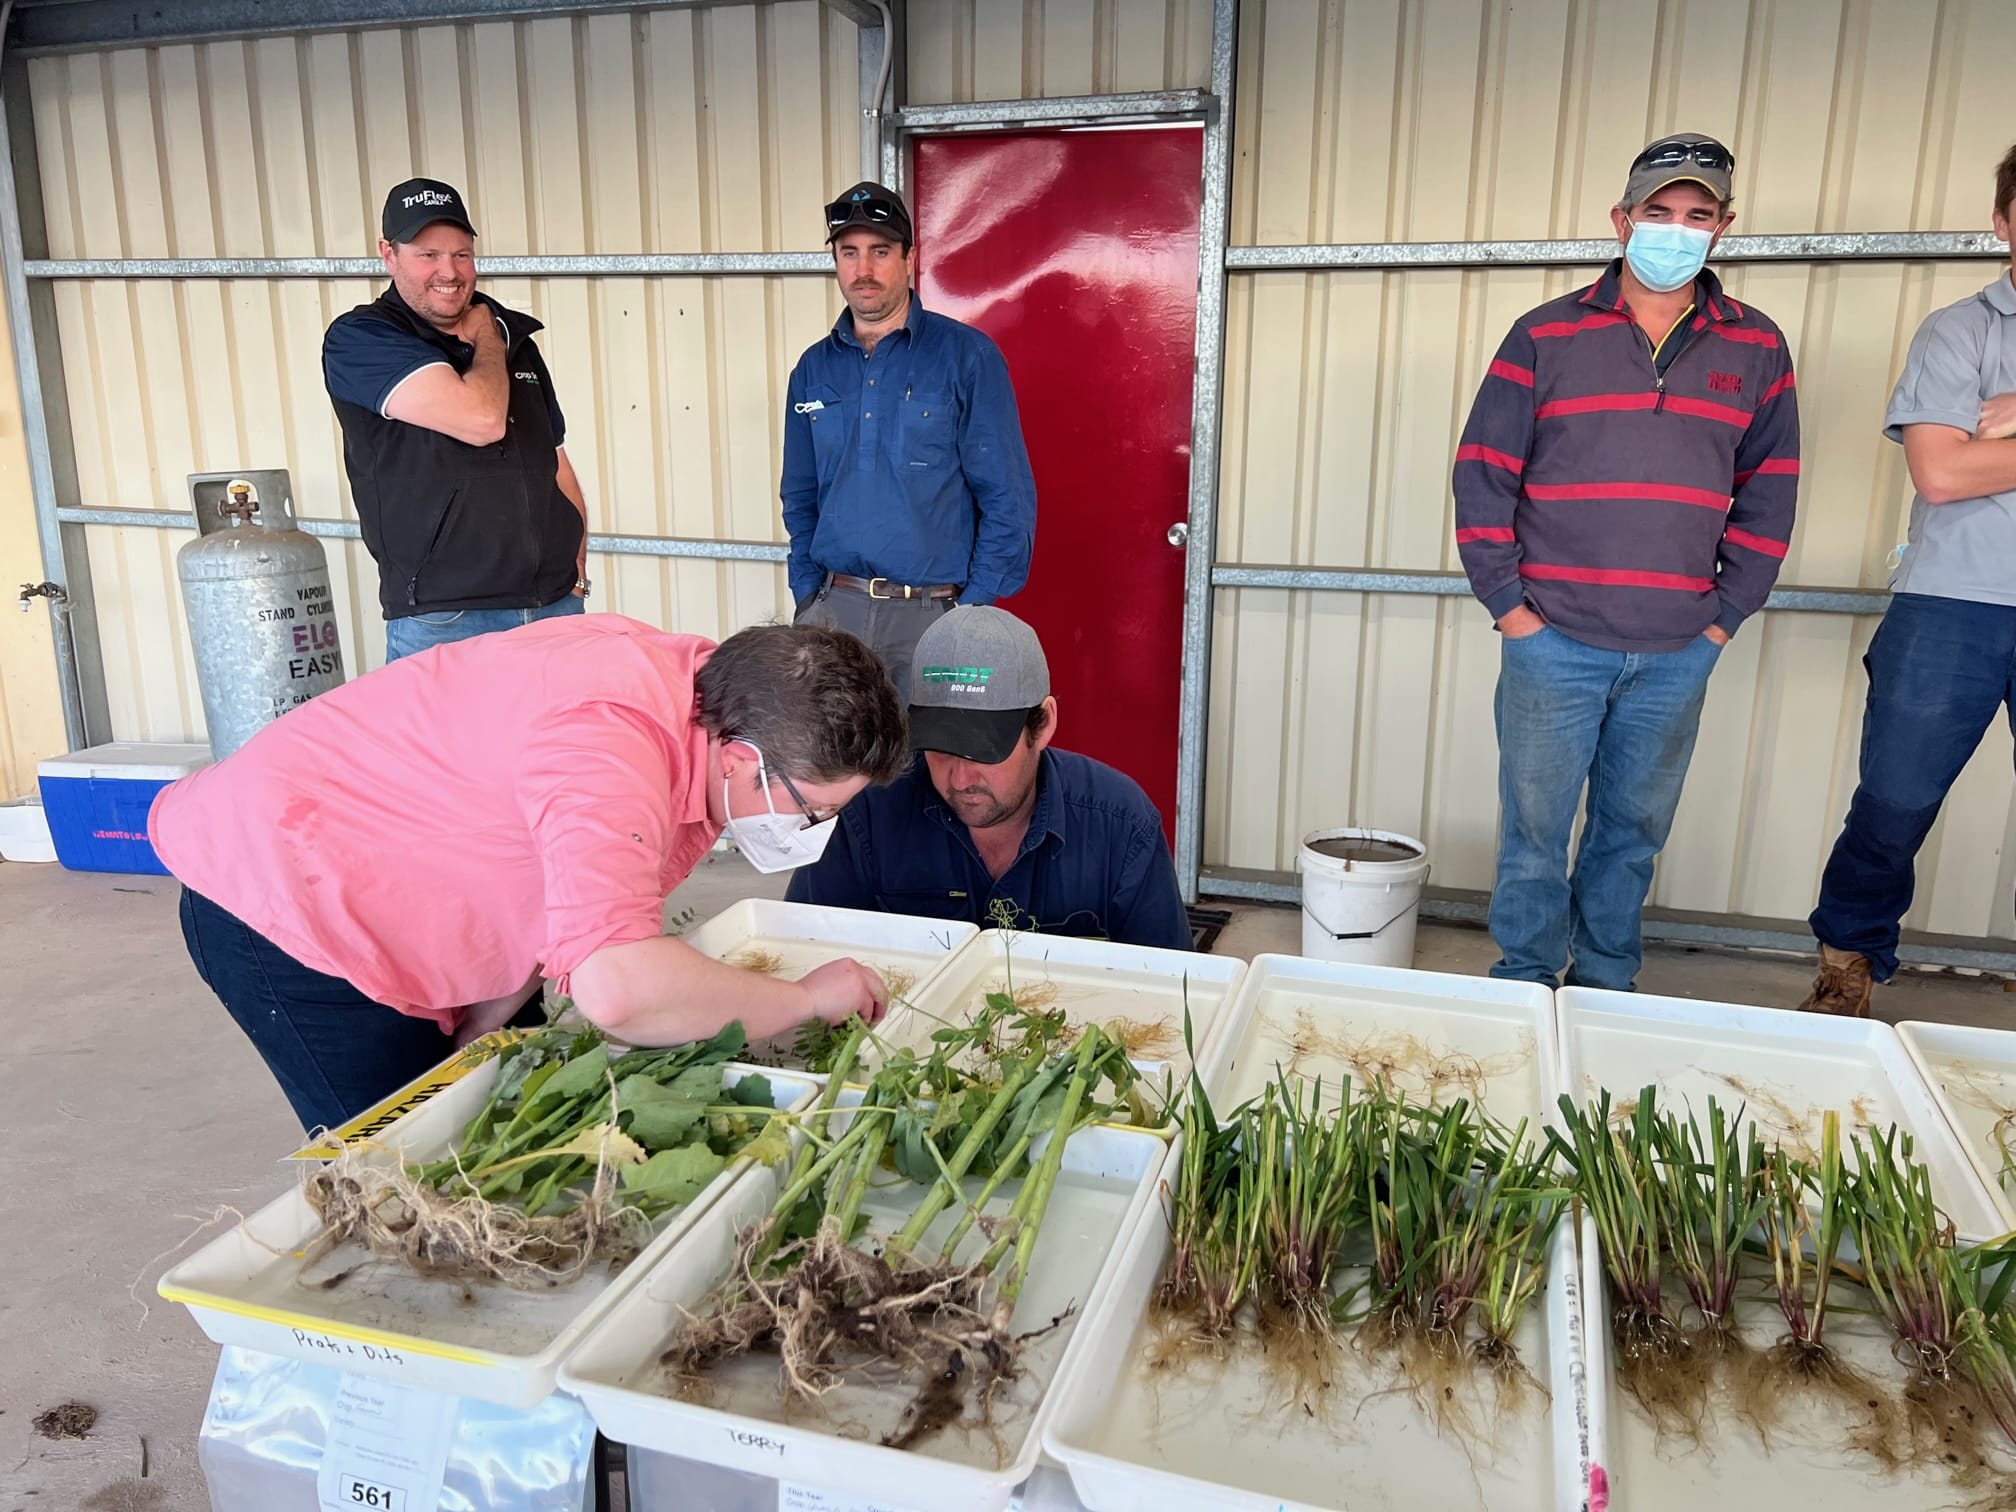
In season biomass was assessed in July and August/September using NDVI and biomass samples. Youngest emerged blade (YEB) samples were sent for tissue analysis to assess nutrient concentrations.
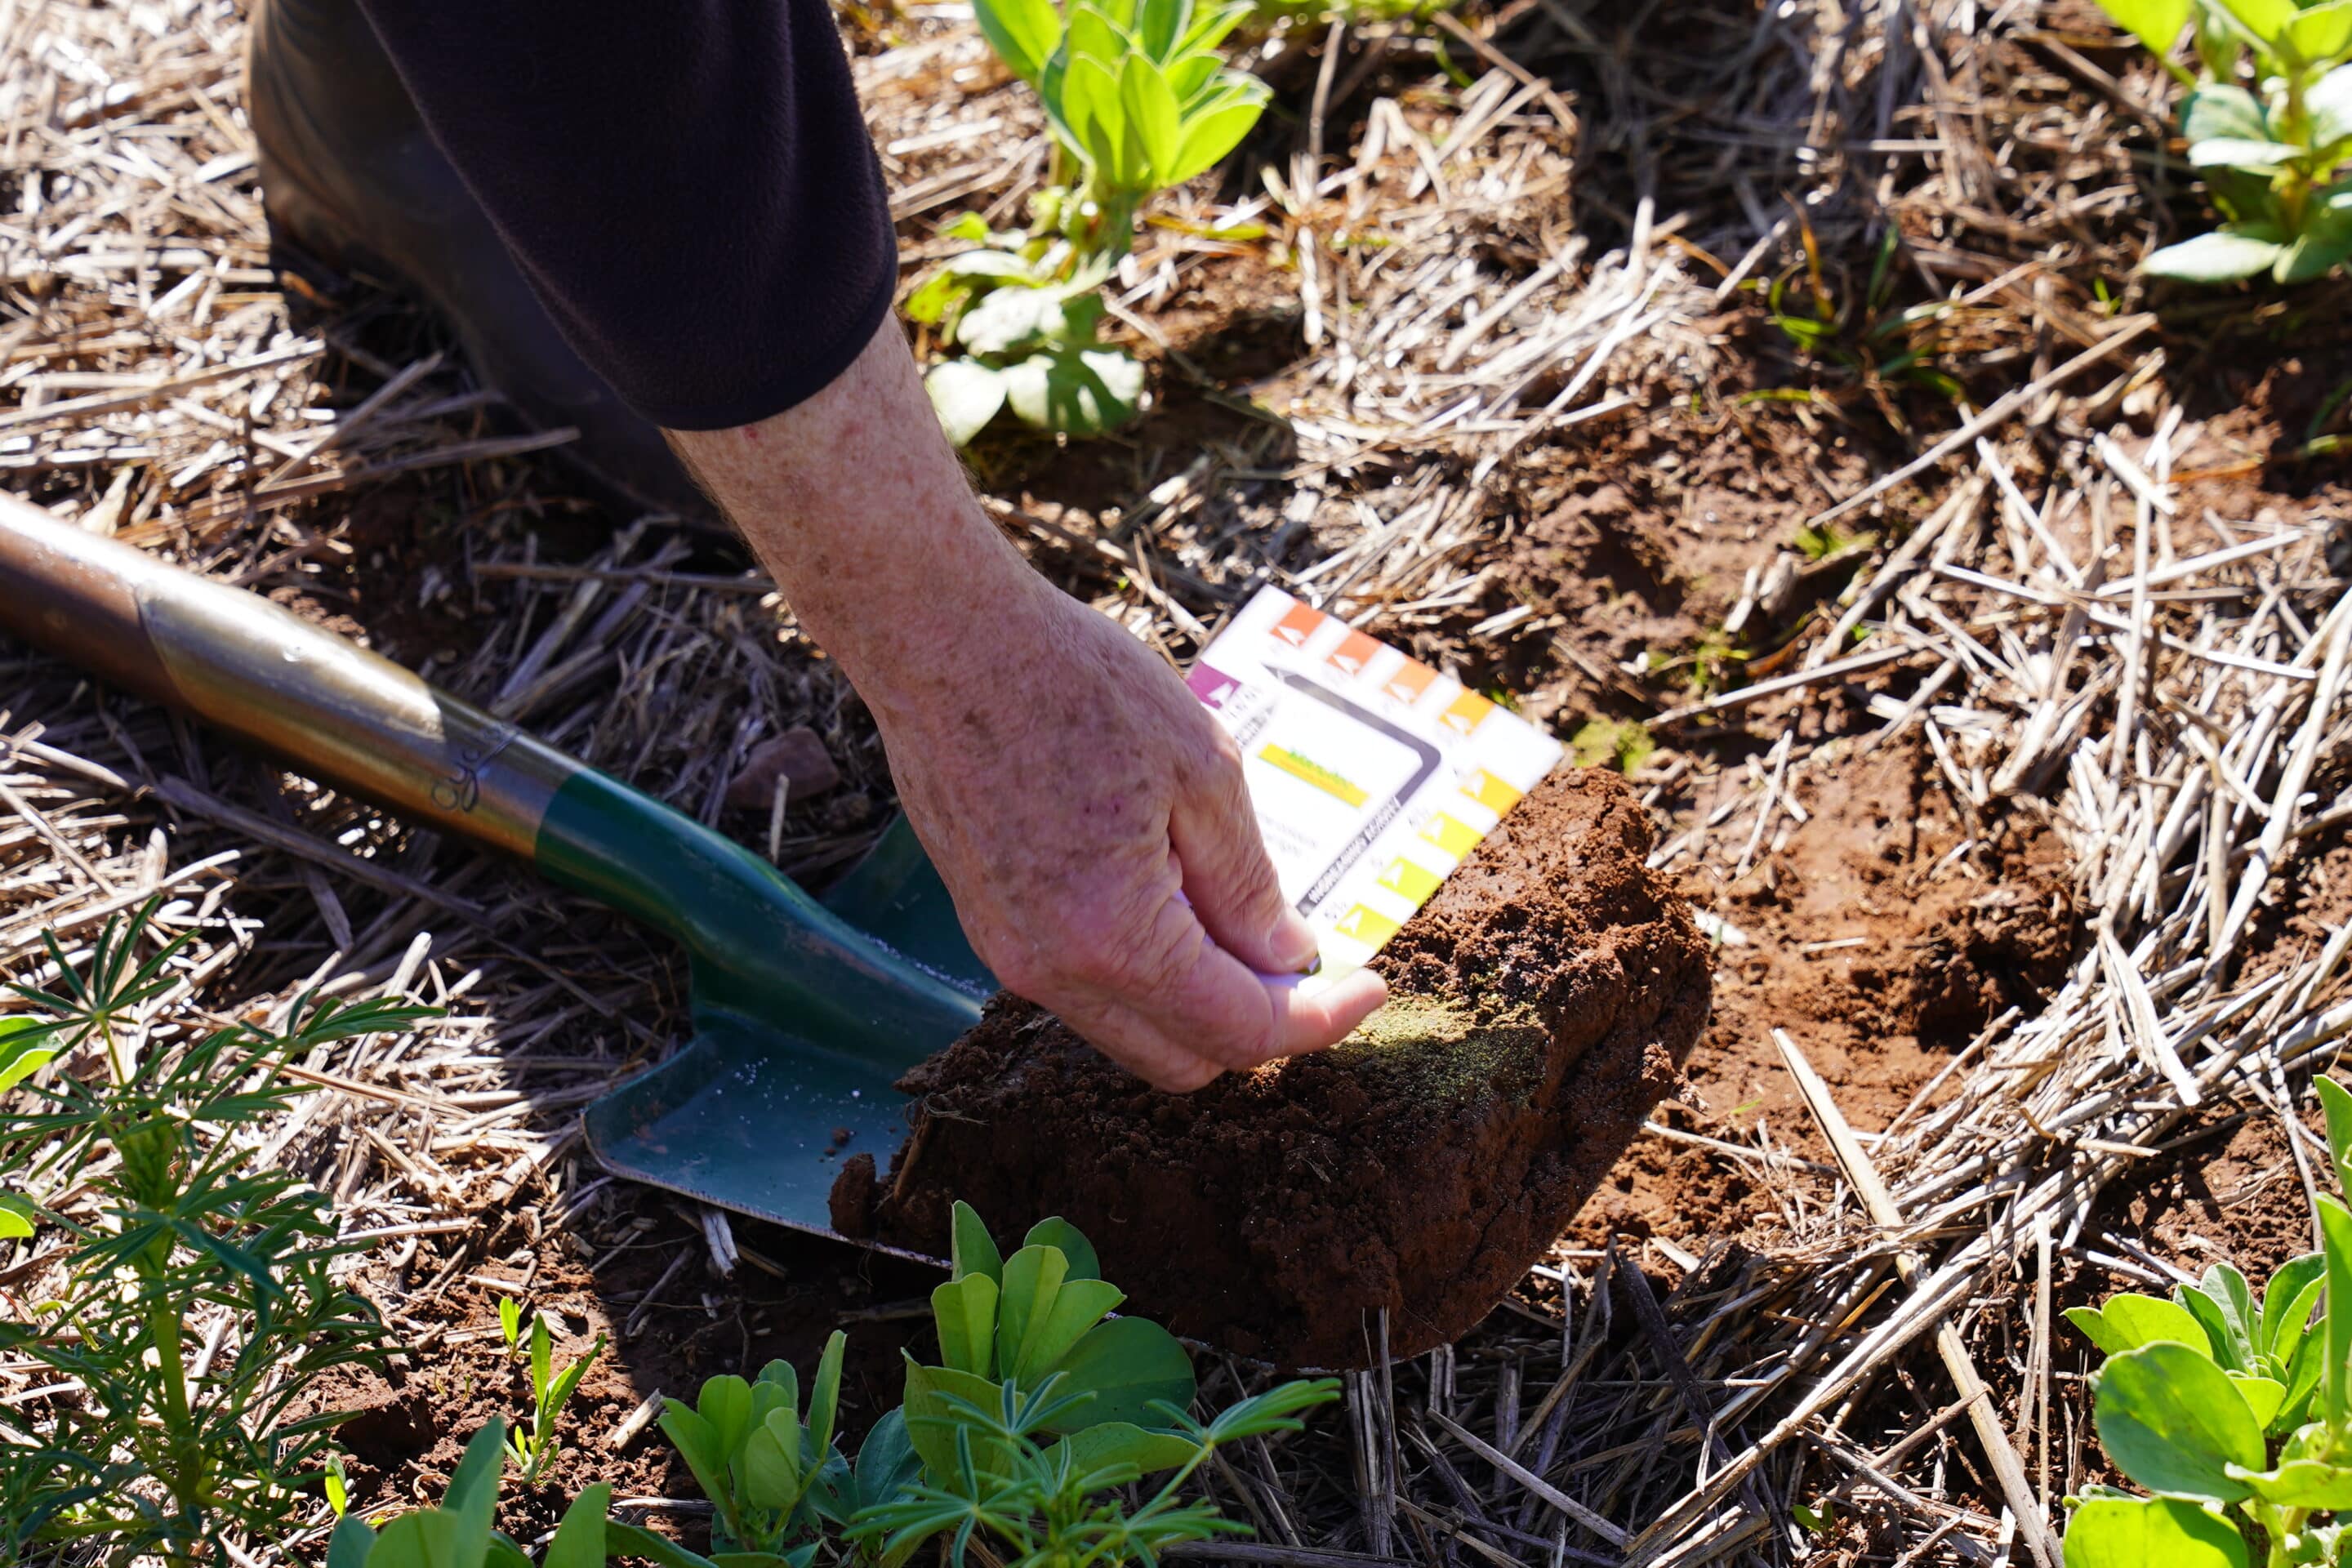
Grain yield data was collected using a plot harvester and grain samples were sent for grain nutrient concentration testing. Soil samples were taken and tested from a selection of responsive treatments.
Results
Combining soil pH maps with historical NDVI imagery was found to provide a good prediction of P response. This validated the premise that areas with high soil pH and low cereal crop growth would be responsive to higher P rates, whereas areas with lower soil pH and high growth rates would not be likely to require additional P.
It was found that targeting P to areas where a good response was likely delivered an average increase in partial gross margin of $41 per hectare. In addition, P fertiliser cost savings could be realised by identifying areas where lower to no P fertiliser could be applied without a yield penalty.
Project Participants
Trengove Consulting: Sam Trengove, Stuart Sherriff, Jordan Bruce
Agronomy Solutions: Sean Mason
Growers: Leigh Fuller, Bill Trengove, James Venning, Kenton Angel
The Problem
Phosphorus fertiliser is a high variable input cost for grain growers, but P requirement (and benefit) can vary widely across paddocks.
The research
Spatial data was combined to predict areas likely to have a good P response and the predictions were validated with field trials.
More information
Sam Trengove, Trengove Consulting
T: 0428 262 057
E: [email protected]


Value for Growers
Using spatial data layers to develop predictive P response maps has the potential to deliver significant savings and improve farm productivity. The focus paddocks in this project were representative of the upper YP and Mid North region, or about 400,000 hectares.
The area of predicted high P response ranged from 16 per cent to 40 per cent across the five paddocks.
Estimating 20 per cent as a conservative mean across the whole region and a partial gross margin gain of $41/ha from optimised P application versus a replacement rate, this equates to a potential annual benefit of $3.28 million – or $820,000 per year if just 25 per cent of growers take up the new approach.
There will also be cost savings through reduced fertiliser applications on non-responsive areas.